UI for ASP.NET MVC
ASP.NET MVC Chart Wizard
- Configure multiple charts visualizations by selecting data from an external source or a Grid with Telerik UI for ASP.NET MVC Chart Wizard.
- Part of the Telerik UI for ASP.NET MVC library along with 110+ professionally designed UI components.
- Includes support, documentation, demos, virtual classrooms and more!
-
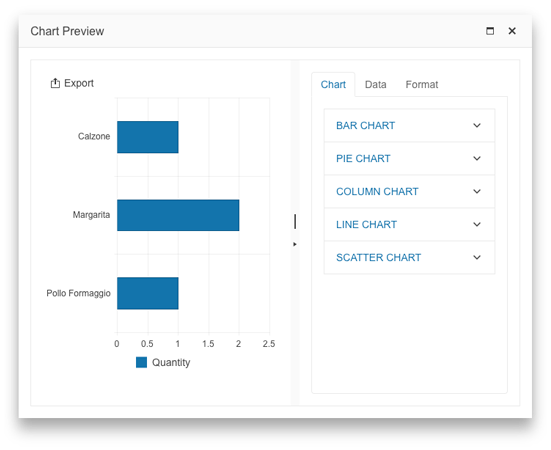
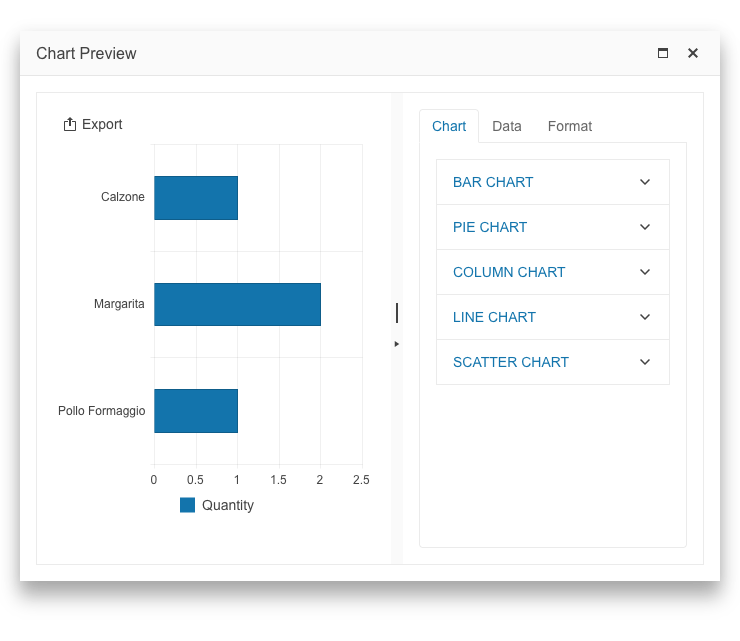
Multiple Charts Configuration with ASP.NET MVC Chart Wizard
The Telerik UI for ASP.NET MVC Chart Wizard enables you to configure the visual representation in various charts by pulling data from external sources or a Grid, customize chart types, and fine-tune elements like series, axes, titles, and legends. With its intuitive interface, you can build charts in just a few clicks, tailor every detail to fit your needs, and effortlessly export them as PDF, SVG, or PNG files.
-
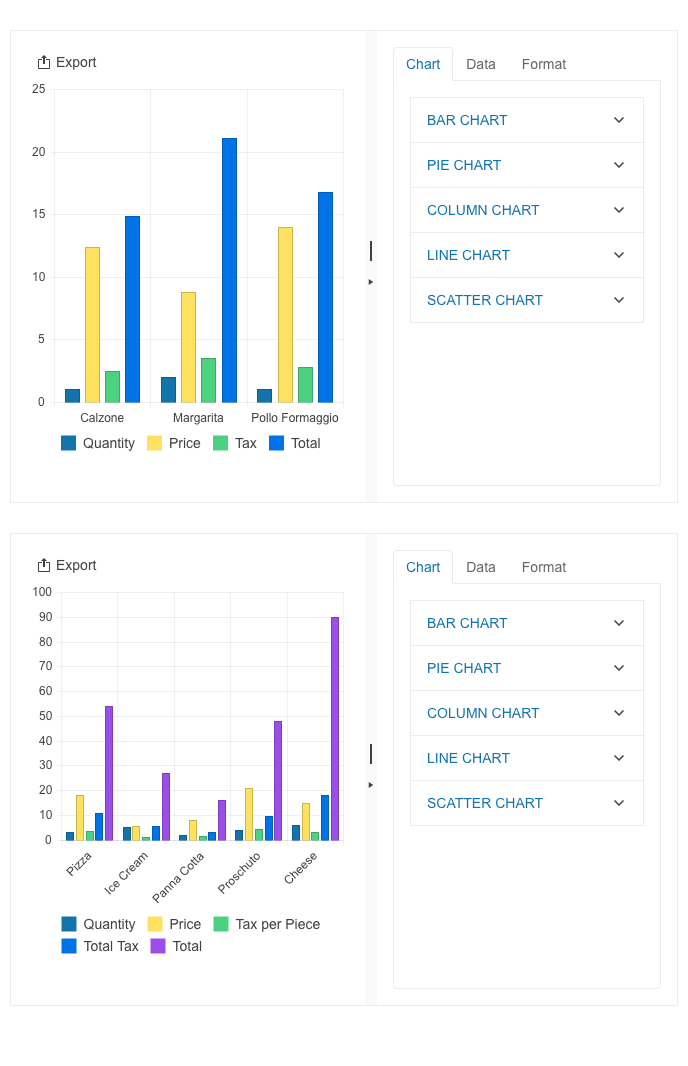
Data Binding
A variety of data binding options are supported by the Telerik UI for ASP.NET MVC Chart Wizard:
- Local binding: Enables you to pass an arbitrary Model directly within the boundaries of the component.
- Remote binding: Enables you to load the chart data through a remote endpoint.
- Razor Pages support: Seamlessly integrate the ASP.NET MVC Chart Wizard in Razor Pages applications.
See Telerik UI for ASP.NET MVC Chart Wizard data binding documentation
-
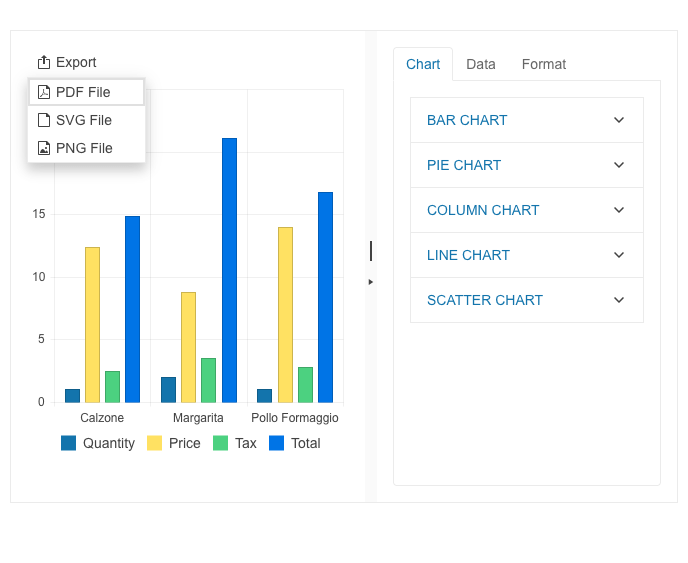
Export Options
Effortlessly export the generated charts to PDF, SVG, or PNG formats. For even greater control, you can fine-tune the export settings with the ExportOptions() configuration. It allows you to adjust paper margins, size, title and image dimensions.
See Telerik UI for ASP.NET MVC Chart Wizard export options demo
-
Window Configuration
By design, the Telerik UI for ASP.NET MVC Chart Wizard is displayed in a Window component. With the Window() configuration, you have full control over its settings, leveraging all the advanced features of the standalone Window.
See Telerik UI for ASP.NET MVC Chart Wizard Window configuration demo
-
Events
The Telerik UI for ASP.NET MVC Chart Wizard exposes multiple events like Change, Open, Close, and more which allow you to control the behavior of the UI component.

-
Right-to-Left (RTL) Support
The Telerik UI for ASP.NET MVC Chart Wizard supports right-to-left configuration. The RTL functionality is supported by most of the UI components to accommodate users who communicate in a right-to-left language script, such as Arabic and Hebrew.

-
Keyboard Navigation and Accessibility
The Telerik UI for ASP.NET MVC Chart Wizard provides support for all accessibility standards—WAI-ARIA, Section 508 and WCAG 2.2. The component also supports built-in keyboard navigation.
See the Telerik UI for ASP.NET MVC Chart Wizard accessibility documentation